

- Main
- Technologies
- Geonaft Software
- Petrophysics modules
Petrophysics modules
Single well layout
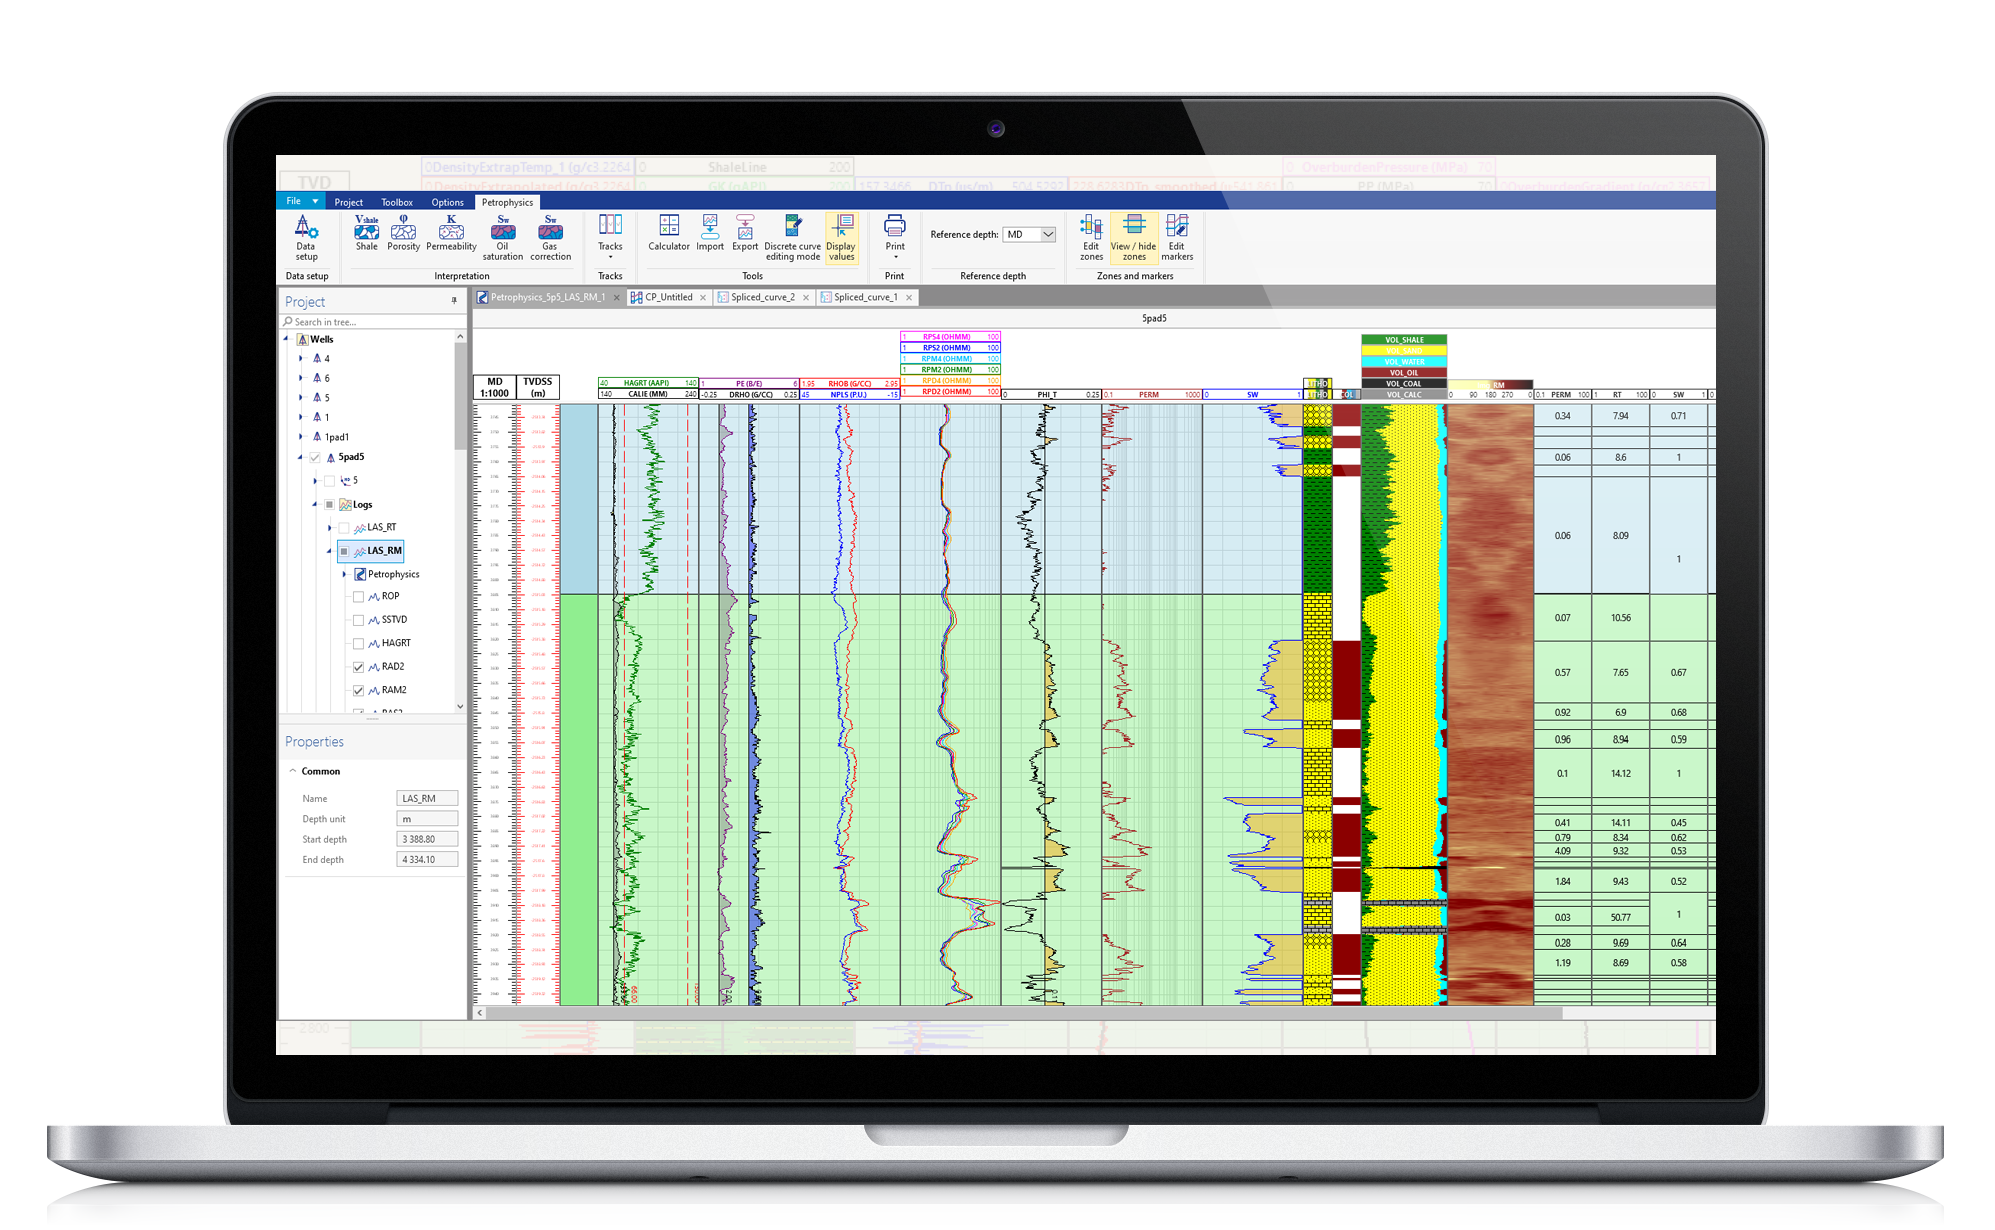
Log view plot displays the following information in the vertical tracks:
- Logging, Blocked and Estimated curves
- Image data
- Point and Text data
- Zonation track
- Iithology and saturation based on discrete curves and Custom Flag
- Cumulative curves
All data can be automatically updated in real time.
Formation evaluation
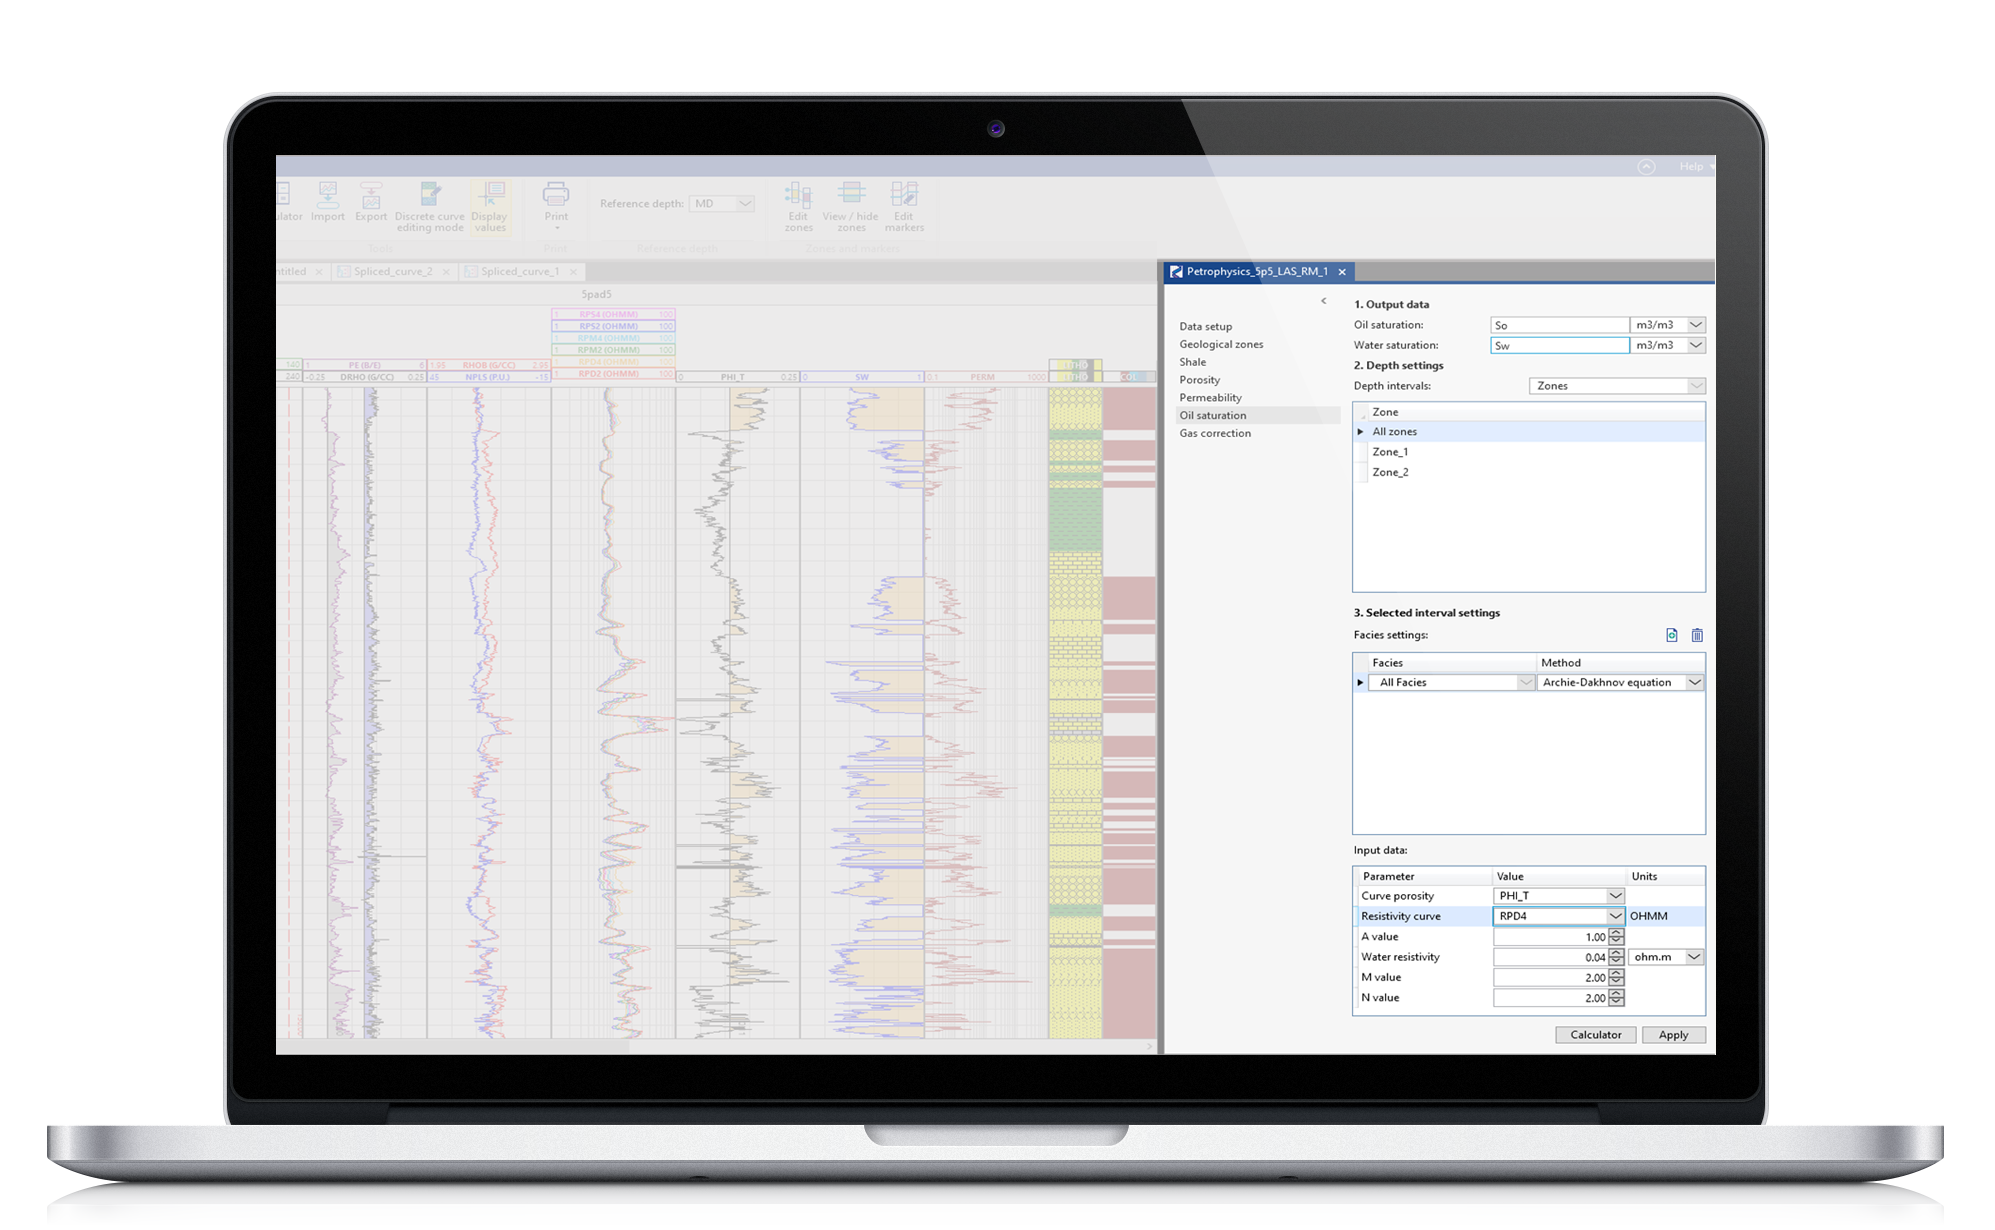
Geonaft contains a set of solutions for conventional logs interpretation. It includes tools to help you with determining standard petrophysical properties:
- Shale volume
- Porosity
- Permeability
- Saturation
- Light hydrocarbon porosity correction
Built-in algorithms support the calculation of parameters for different intervals based on user intervals (zones). AutoUpdate can be applied by the user in RealTime job
Petrophysical Calculator
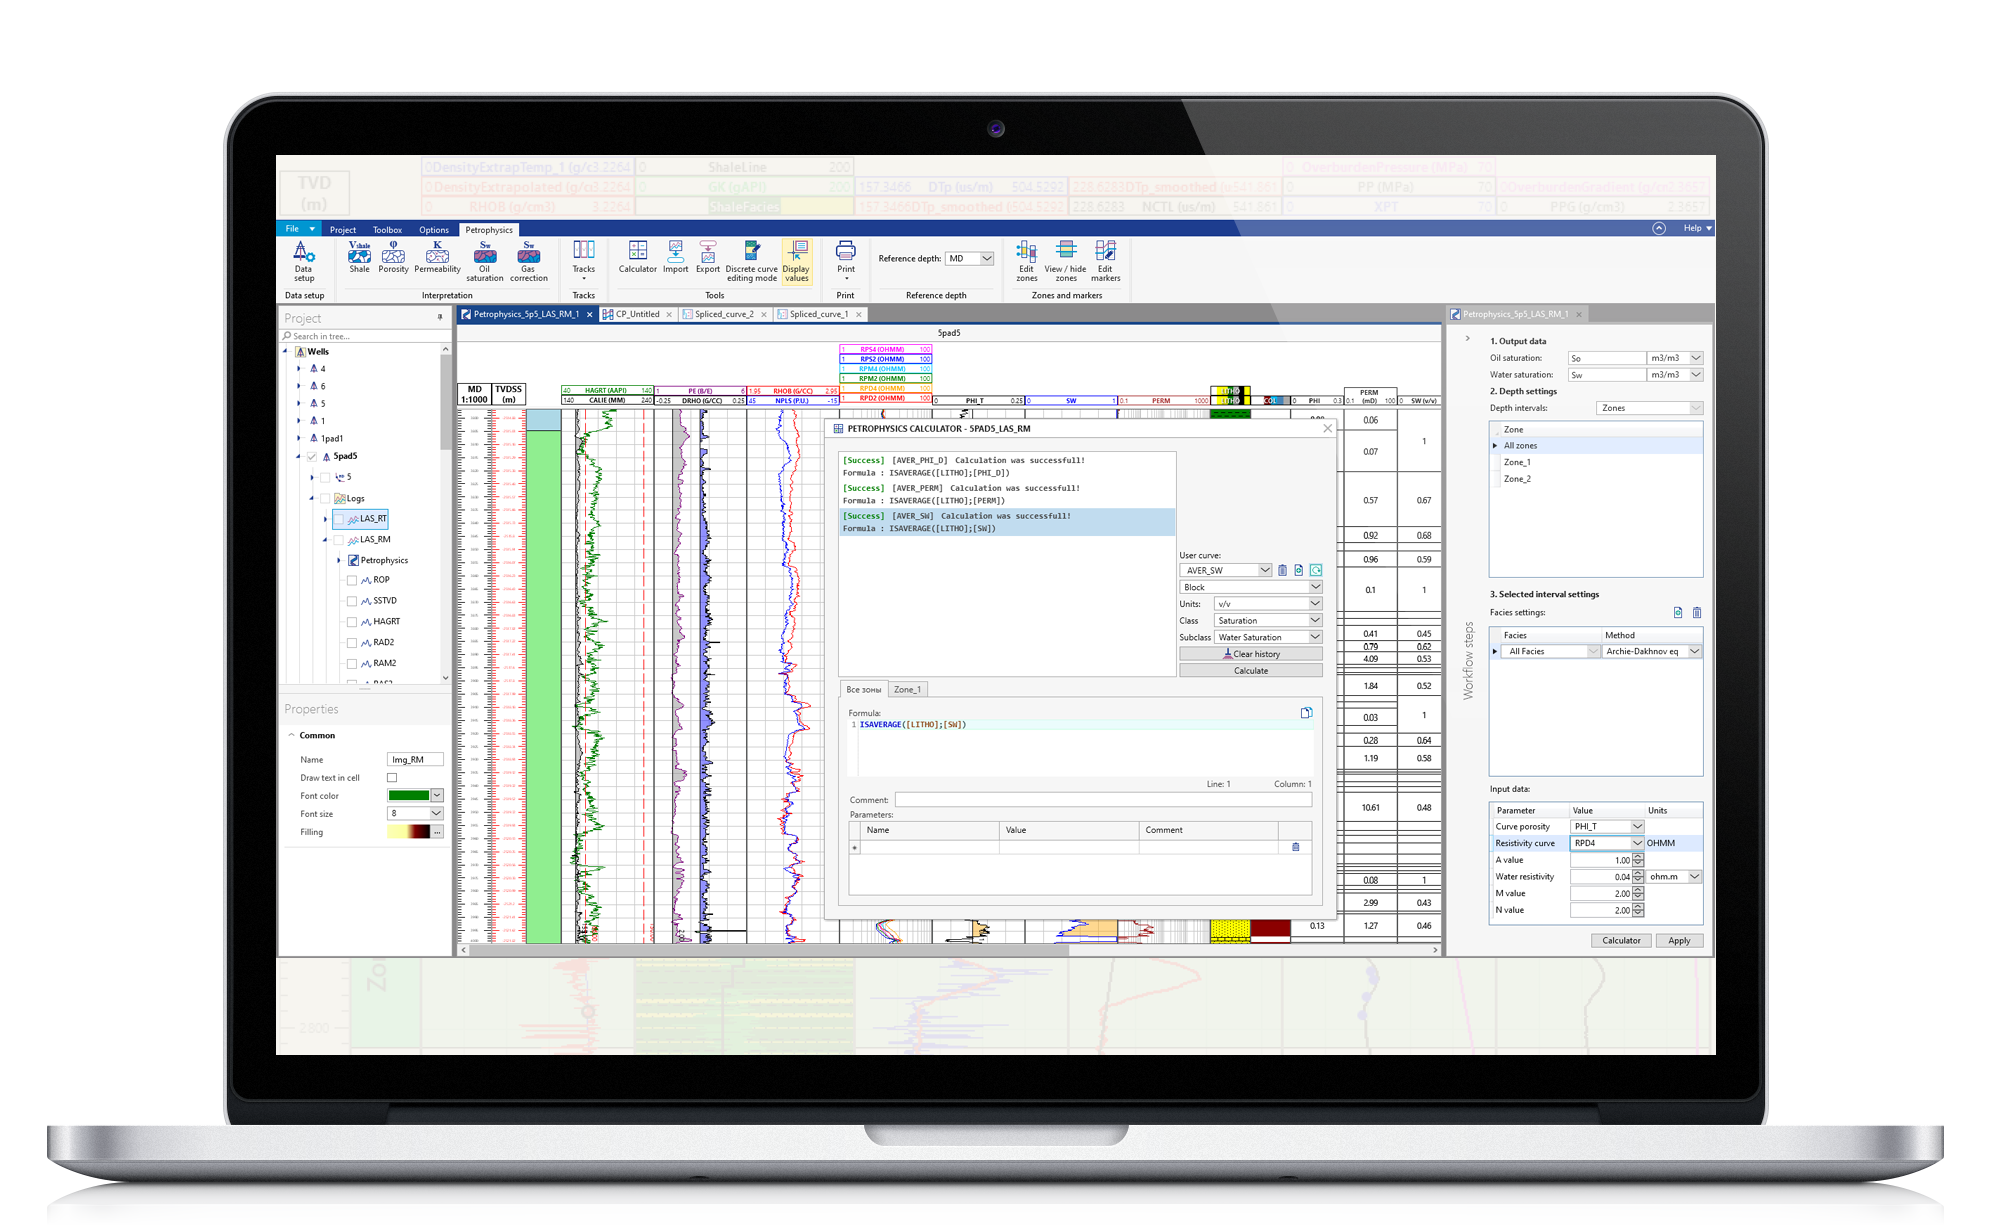
Petrophysical calculator estimates new variables or applies mathematical operations to existing curves. The calculator has a wide range of built-in Functions and Operations (about 50). Many special calculation methods are available for narrow tasks – weighted average by discrete curves, despiking, smoothing etc. Possible use in sidelines of industry – geomechanics, well placement. You can specify the class of the curve and units.
Solution template and Solution library
When working with similar targets it is possible to apply user Solution Templates to speed up the calculations. Geonaft allows you to save a set of user curves in project or export to file with solution templates for each curve. The calculation library consists of a set of predetermined petrophysical functions. Also, it can be extended with a set of algorithms defined by the user.
Data Preparation
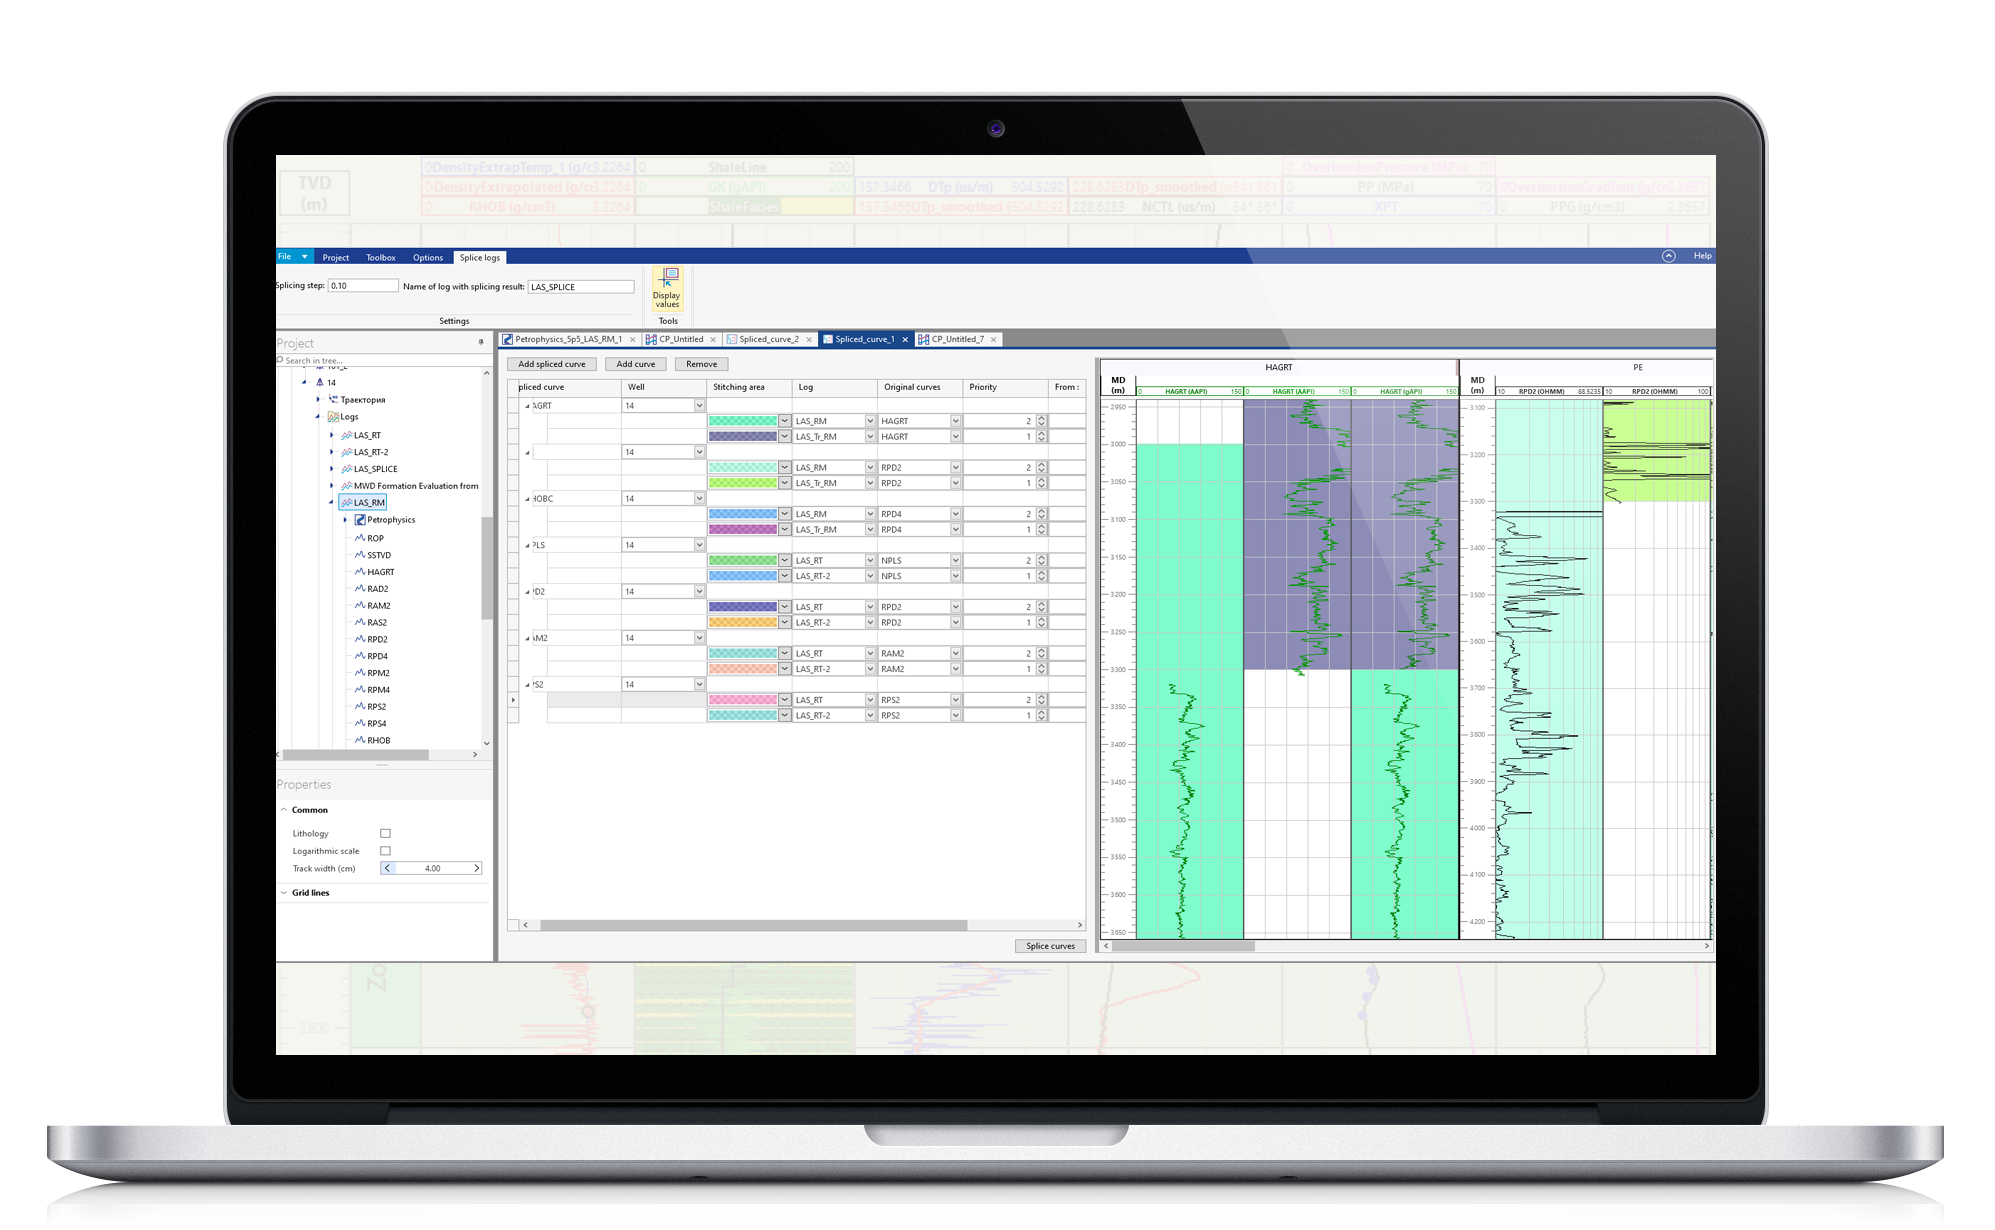
Data preparation for follow-up work is the first and one of the most important stages of work. Favourite menu options:
- Depth shifting
- Splicing
- Despiking
- Smoothing
- Interpolation
This minimum set of functions is essential for real-time data working with low-density sampling.
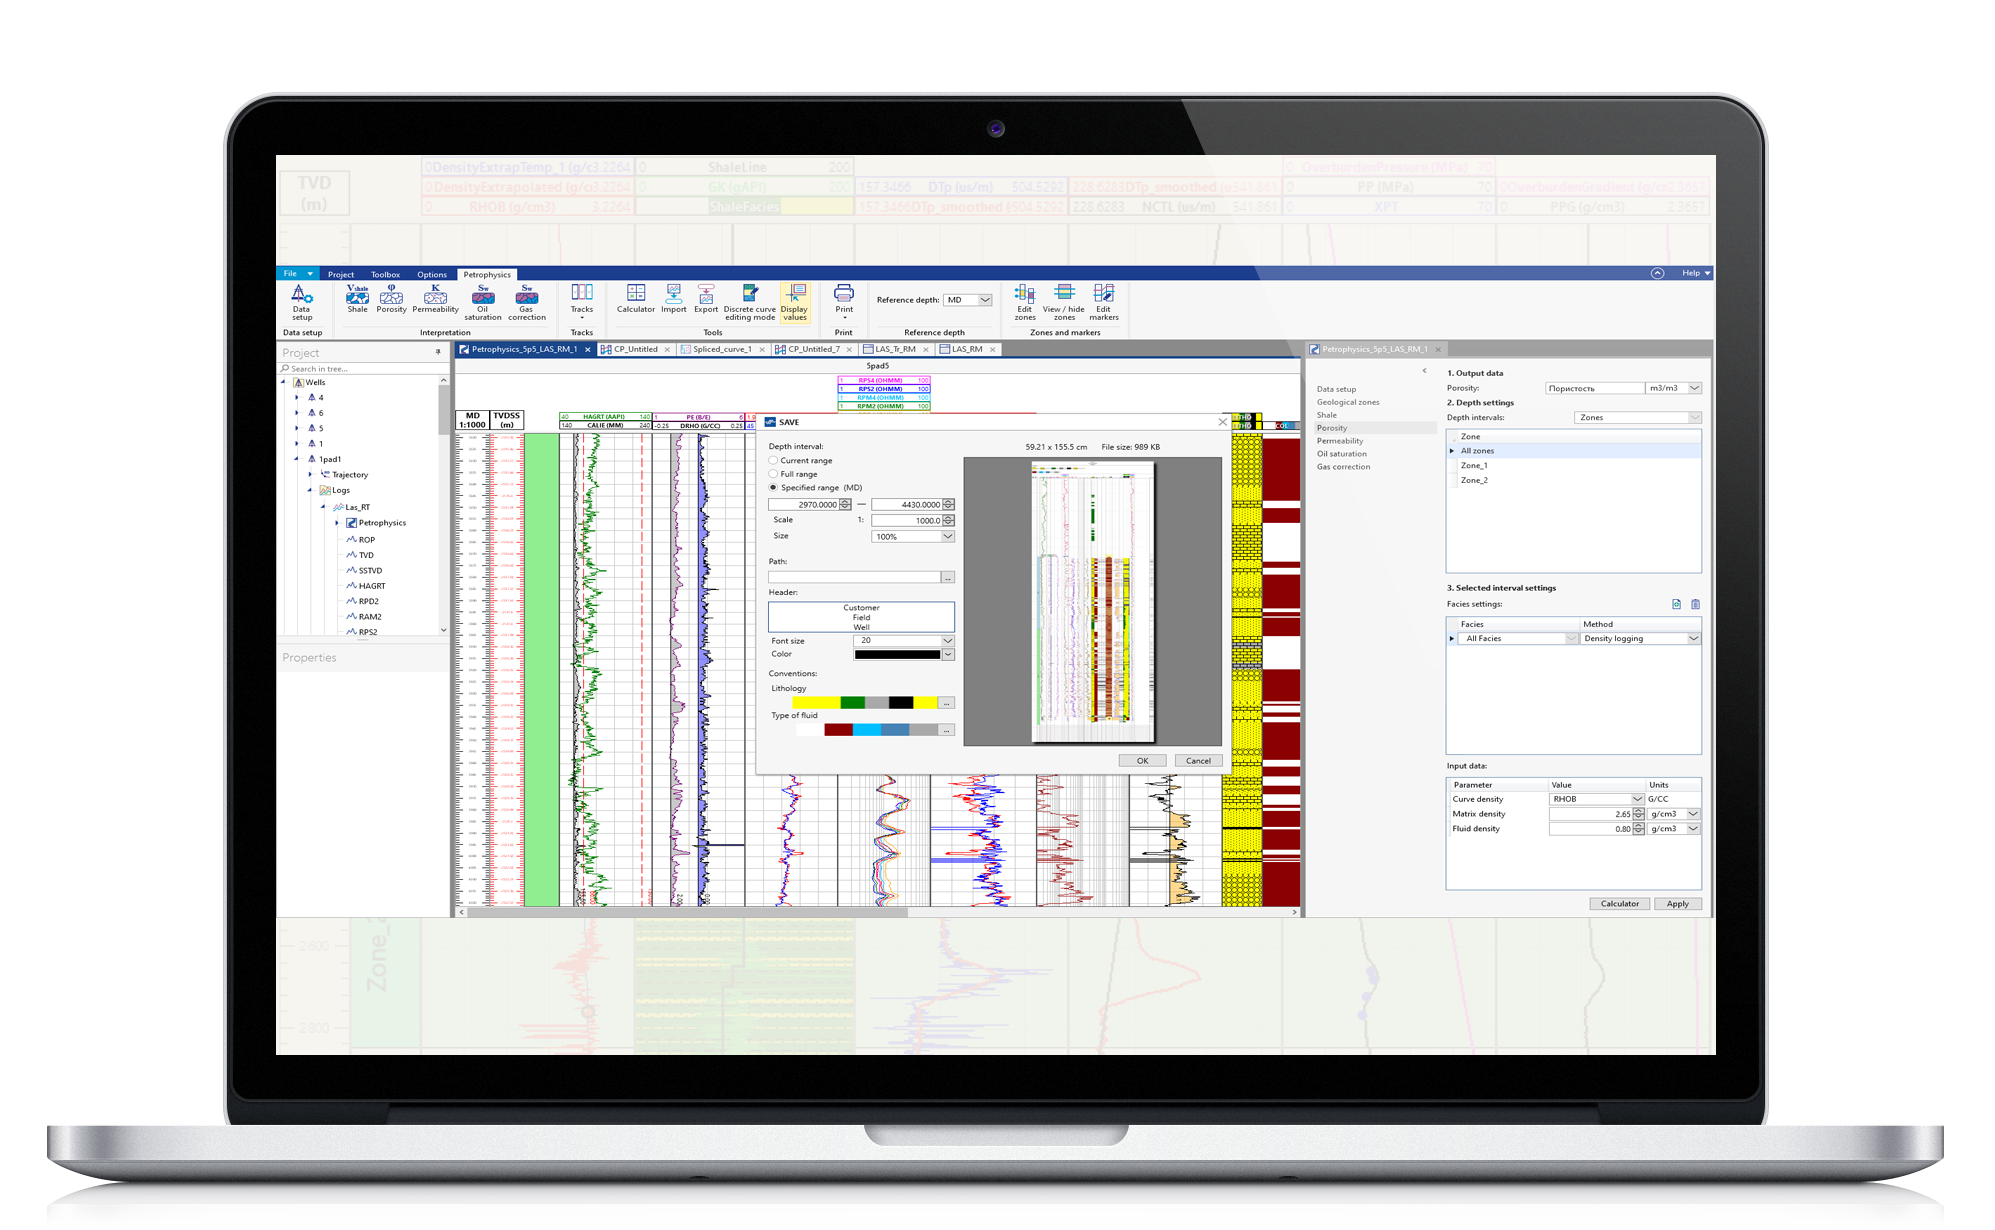
Deliverables
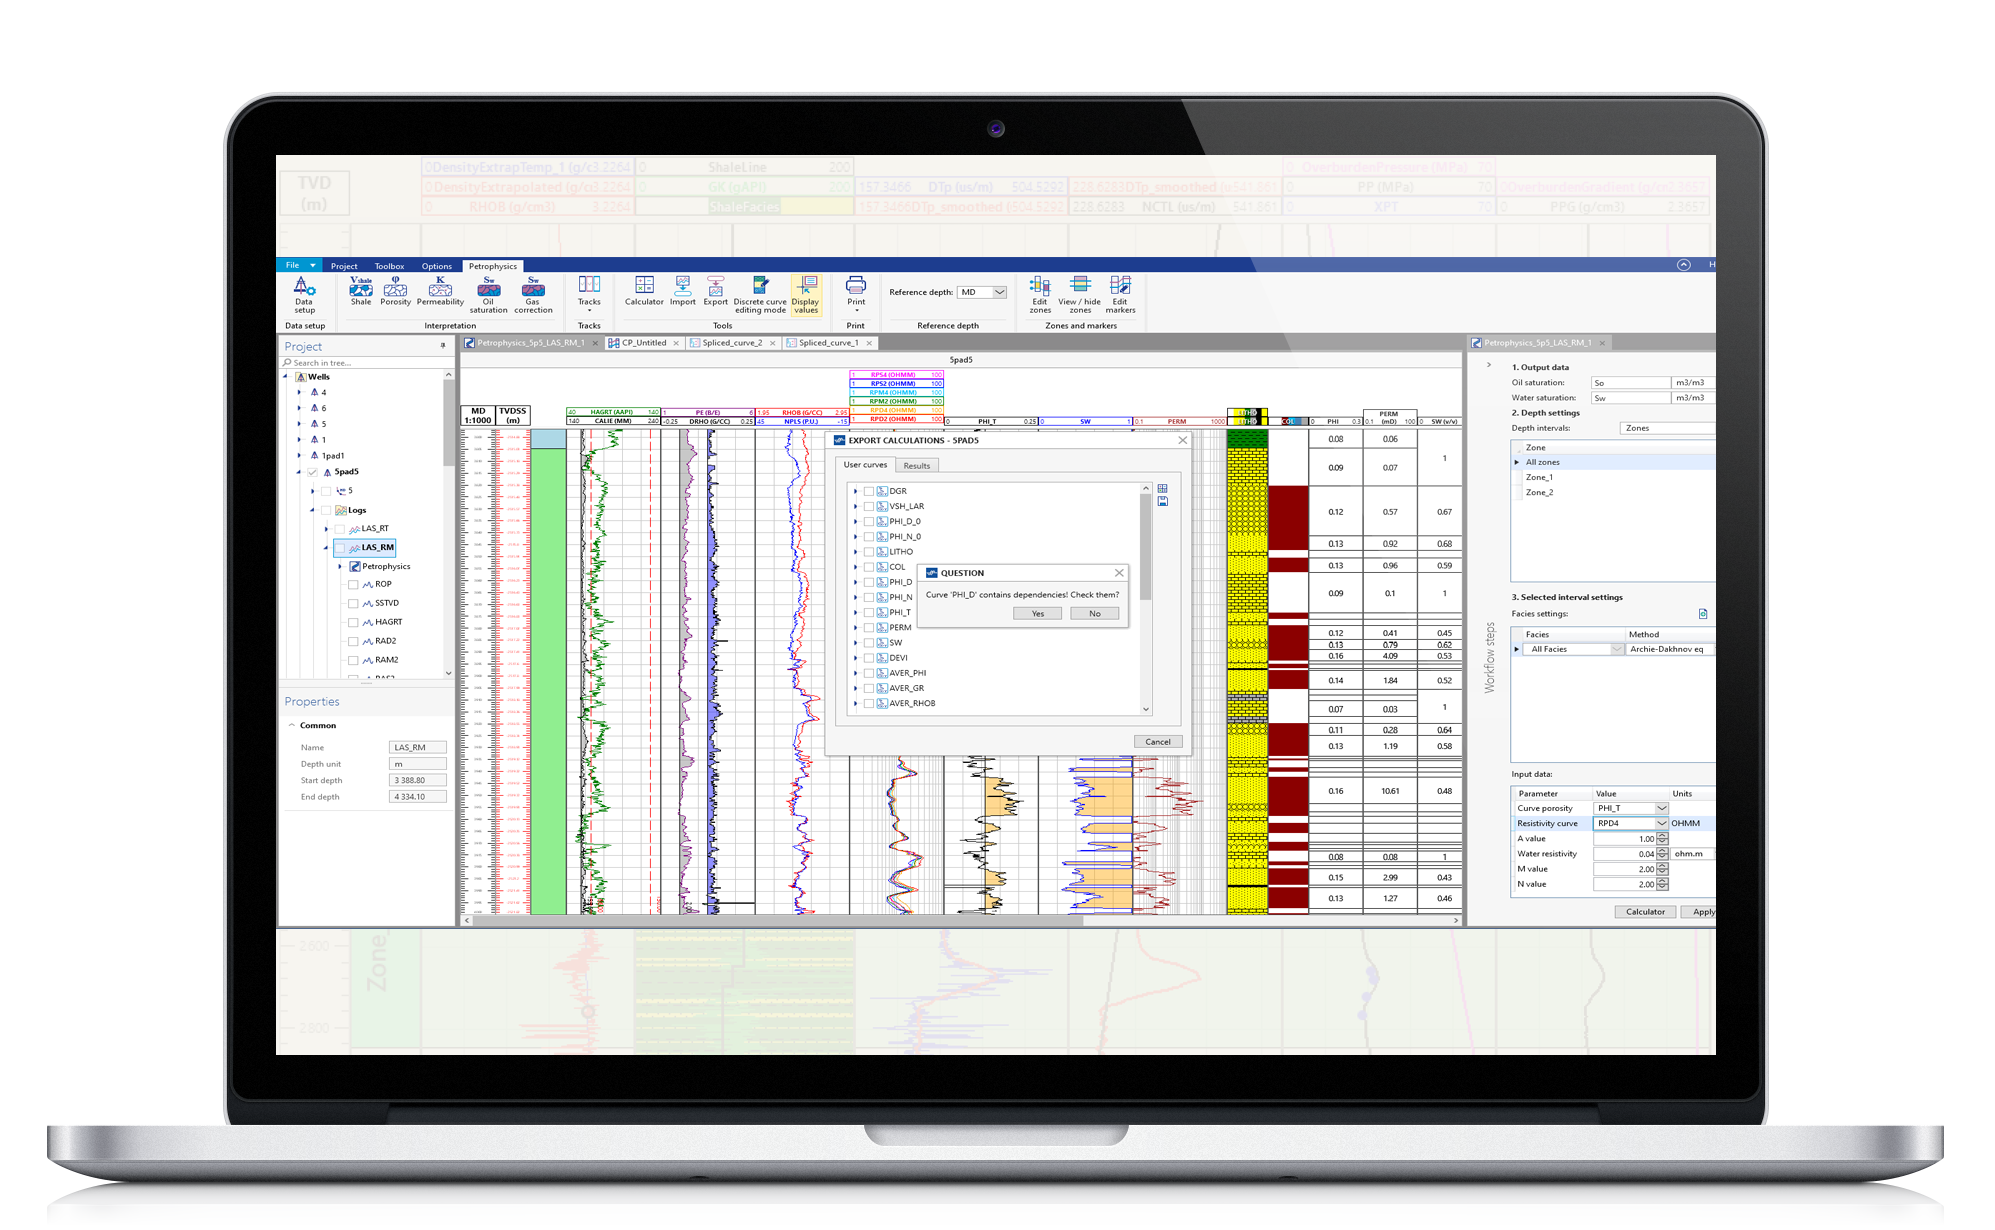
Geonaft generates the following output formats to share data with other applications:
- LAS files
- Export data to Excel and preparation table of interval values
- You can print a continuous depth plot in custom scale
- Geonaft provides several commonly used commercial formats for export plots: *.png, *.jpg, *pdf, *.tiff


